Ying(Veronica) Huang

I am Veronica, an innovative data analyst and a self-motivated learner. It's my belief that data make up this world and can change this world!
Technical skills: SQL, Python, R, Tableau, AWS(Redshift, S3, EC2)
View My LinkedIn Profile
Projects
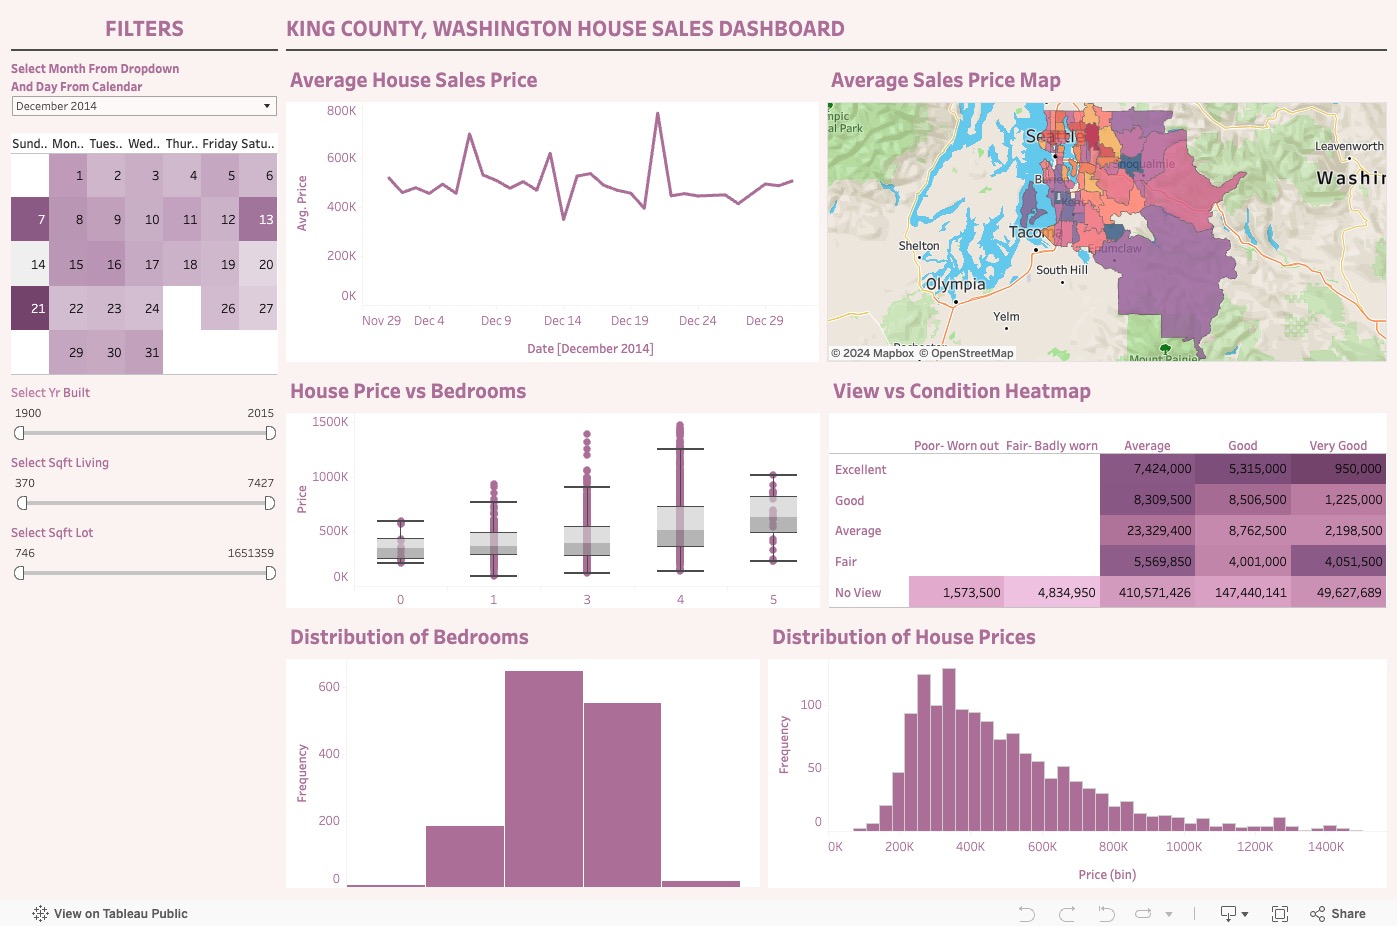
King County House Price Analytics - Data Visualization with Tableau
The goal of this project is to explore the price difference and trend from different dimensions for King County in Washington: Date time, Year built, Sqft living, Sqft Lot. Views can slect year and month from the drop box, select exact date from the calendar if needed, select attributions(Year built, Sqft living, Sqft Lot) from bar.
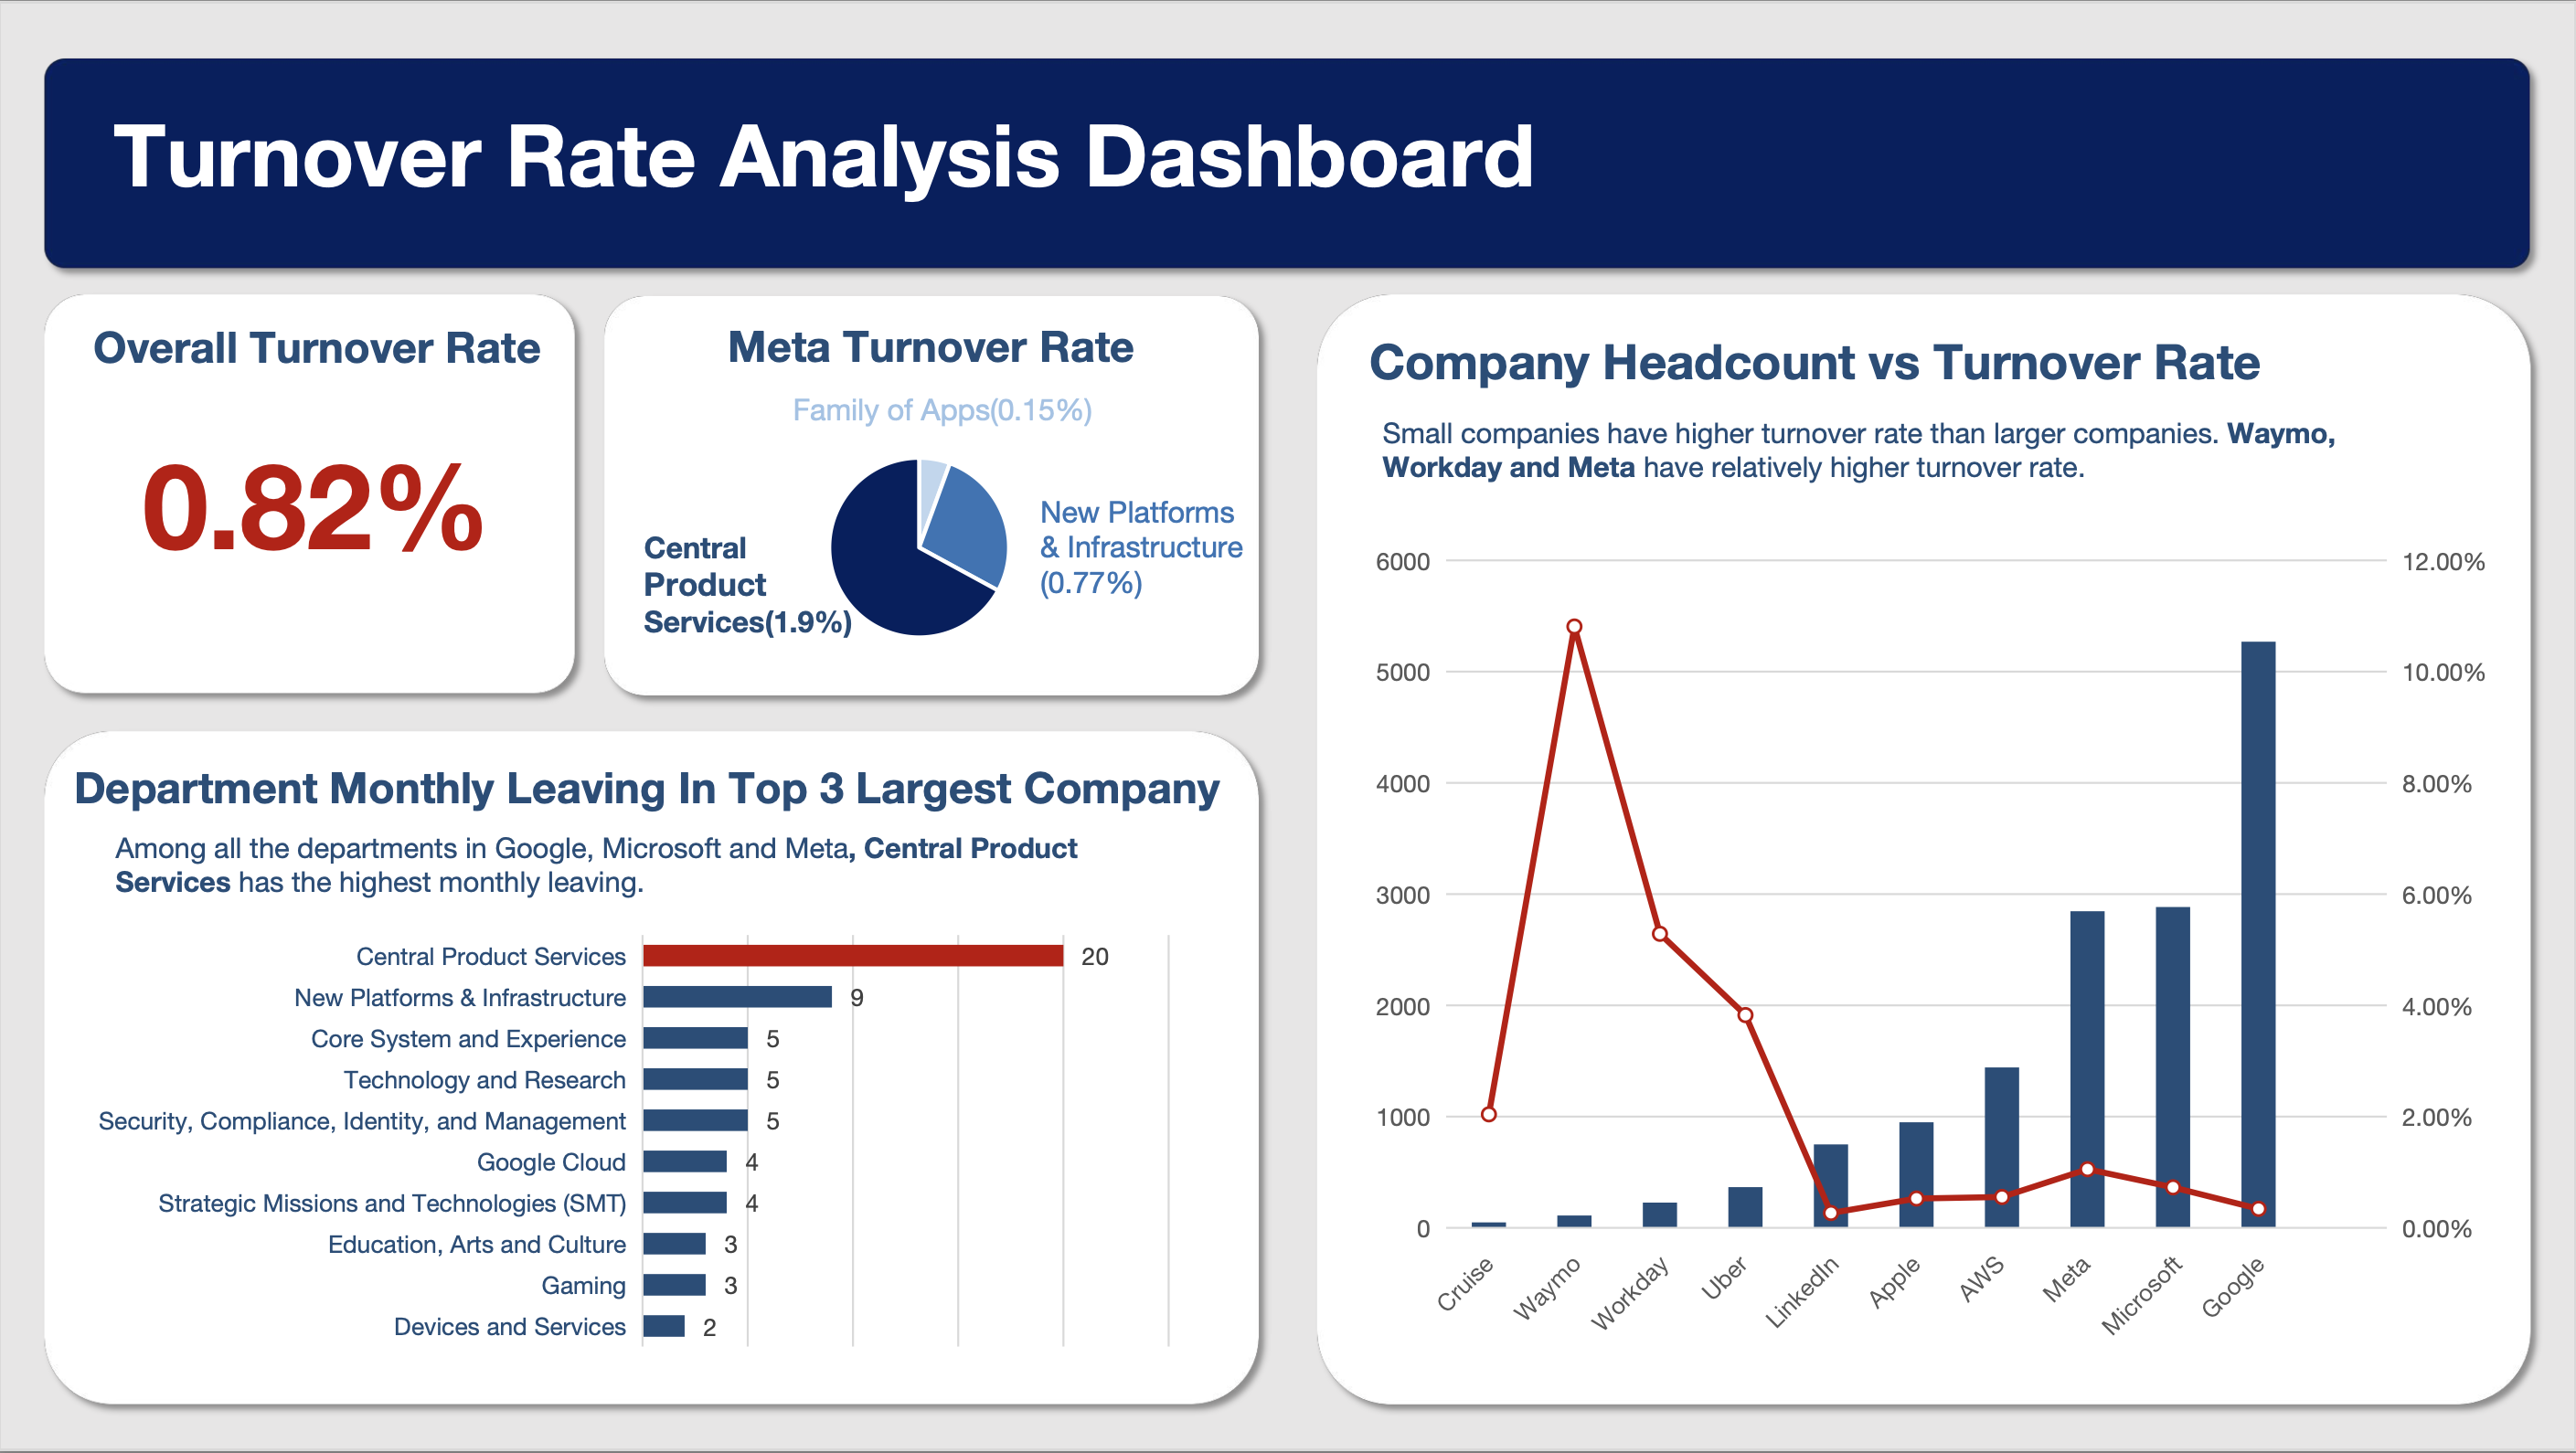
Tech Company Turnover Rate - Data Visualization with Excel
Created an Excel dashboard reporting tech company turnover rate using an excel file storing top 10 tech companies’ headcount numbers, and each department’s monthly leaving number.
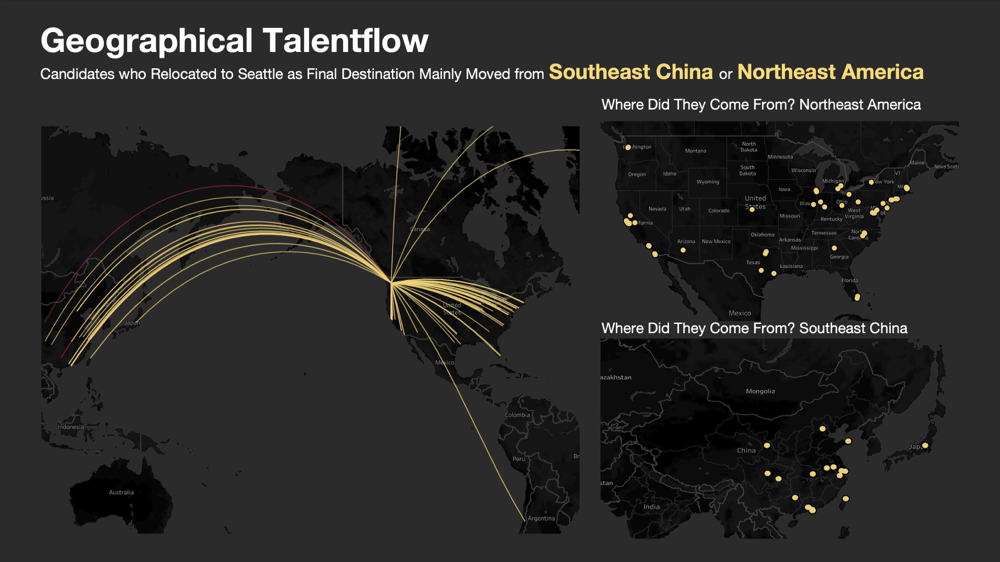
TalentFlow ad hoc - Data Visualization with Tableau
Reported the path of AWS employees’ geographical flow on the map using pickle files storing a list of candidates’ work experiences scraped from LinkedIn using an ETL script.
This dashboard shows the first work location ( if the data is missing, then use the second experience’s location so on, and so forth) as the starting point, and the latest work location as the destination. For instance, if a candidate started his career as an intern in San Francisco Bay Area, then moved to New York and worked for 3 years, and finally relocated to Seattle, then what the graph shows is a line (or curve if you like) from San Francisco Bay Area to Seattle.
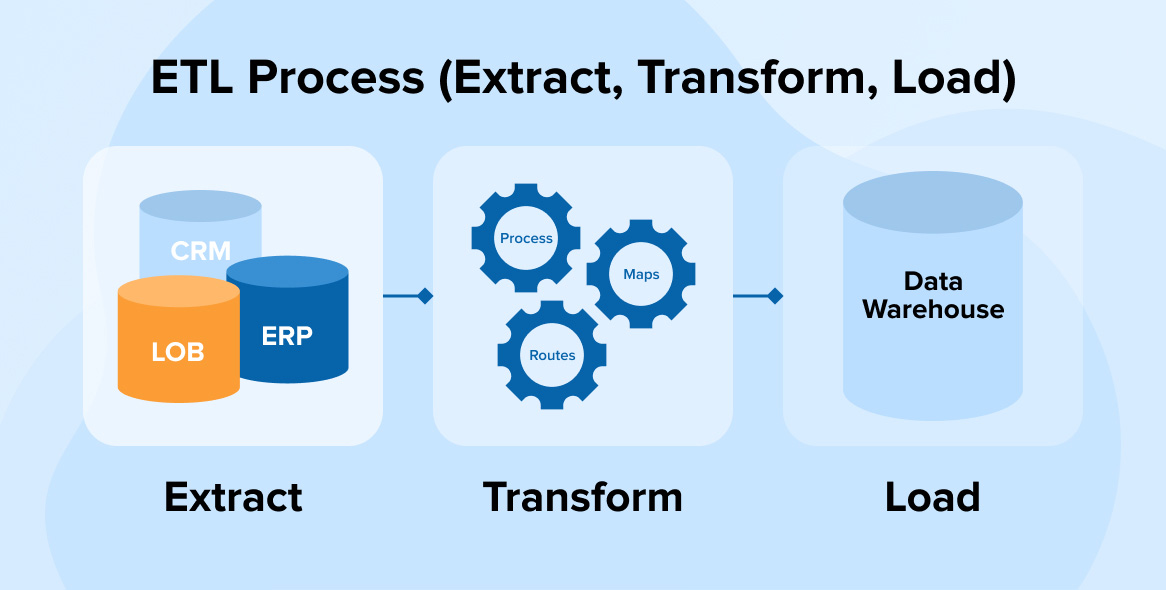
ETL Scripts for Web Scraping - Data Engineering with Python
These ETLs are used to automatically insert new data and update old data in the talent pool. These scripts extracted data from Linkedin using Selenium web scraping, transformed data, and loaded cleaned data to AWS S3 as pickle files. Implemented pipeline to extracted data from S3, transformed and loaded to Mysql data warehouse backed by AWS RDS.
Click HERE to view code.
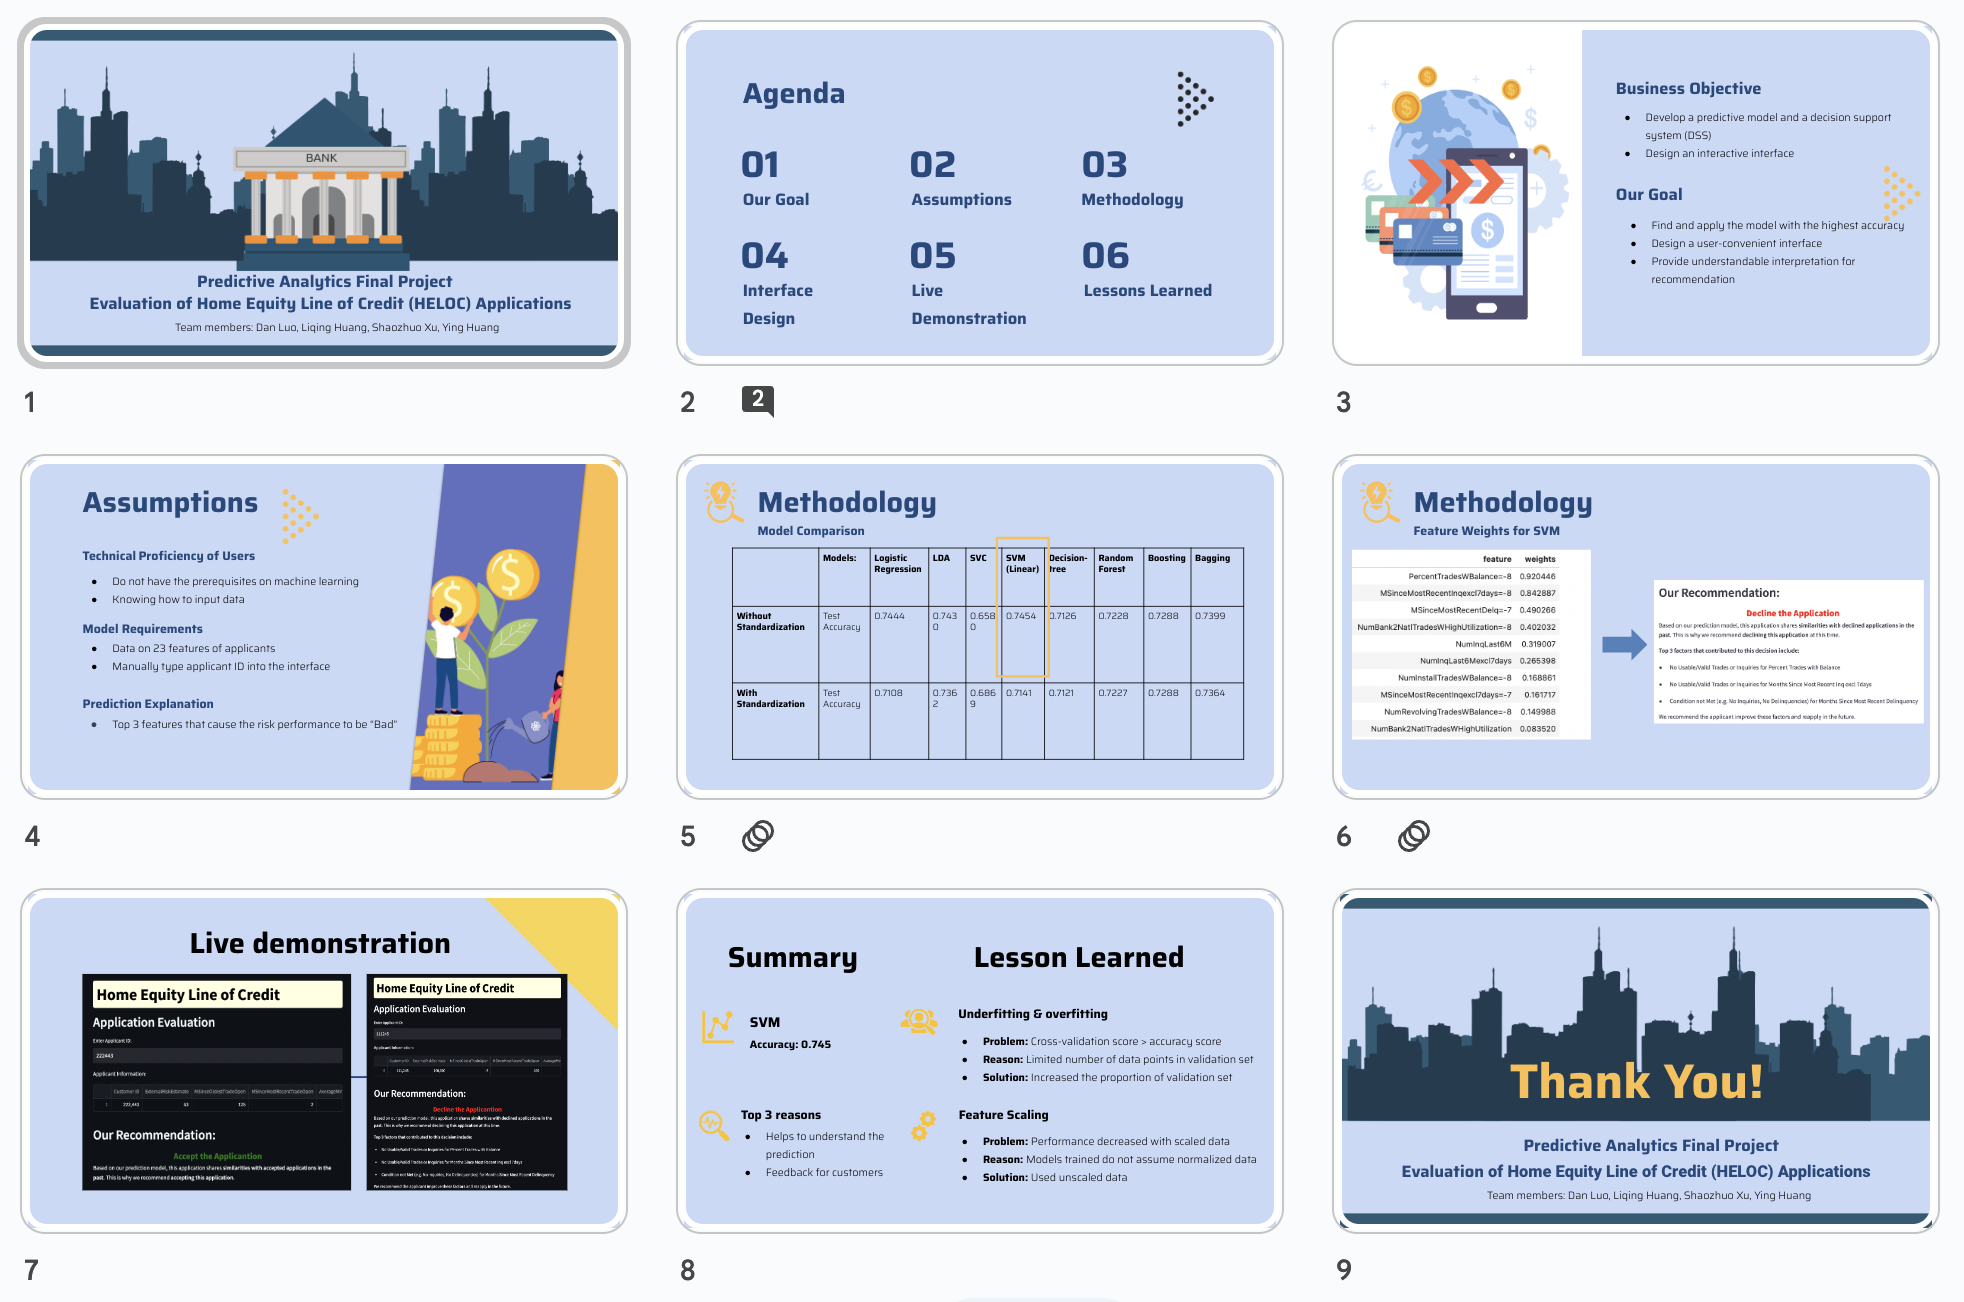
Decision Support System: Machine Learning Project
Utilized the dataset of HELOC applications to predict whether they will pay back their HELOC account. Our vision is to develop a predictive model to access credit risk and combine this with an interactive interface that bank/credit card company’s sales representatives can decide whether to accept or reject an application.
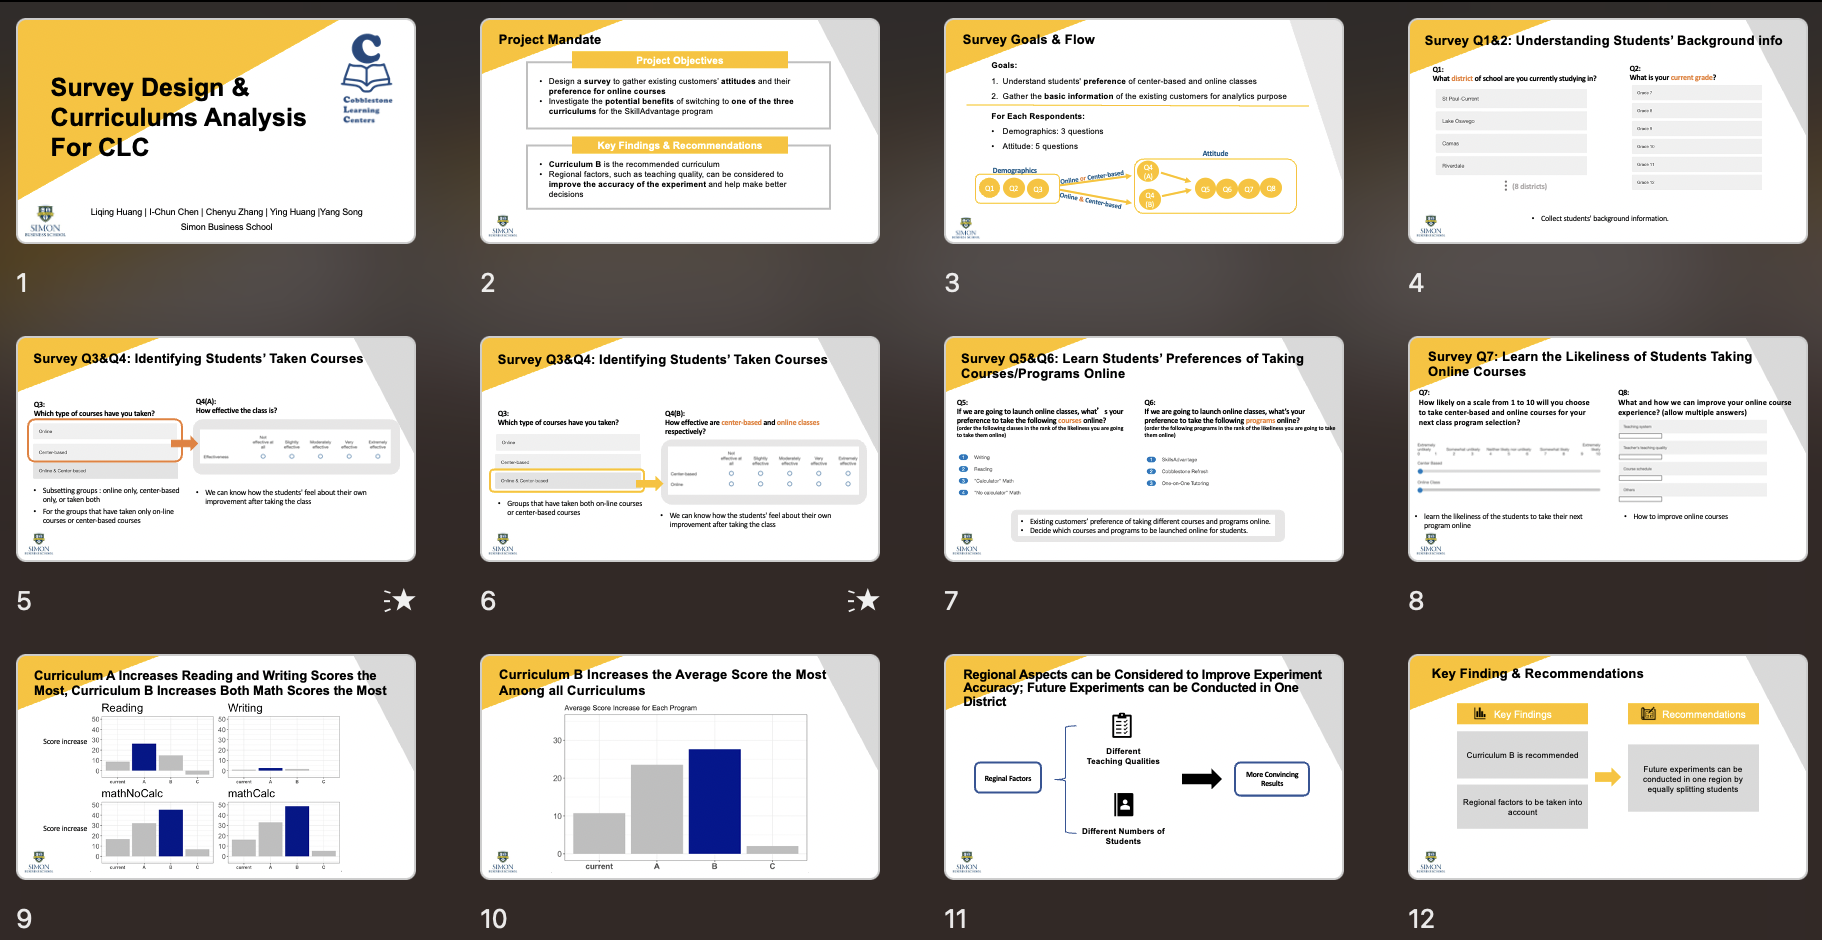
Product Analysis for Cobblestone Learning Center
Managed a project analyzing test scores of 9k CLC students in different study programs. Used visualization tools to generate curriculum utilization and student performances in different districts; Provided recommendations in course selection to increase students’ satisfaction. Conducted A/B test on program effectiveness in virtual and in-person modalities; Helped CLC provide better curricula for students.
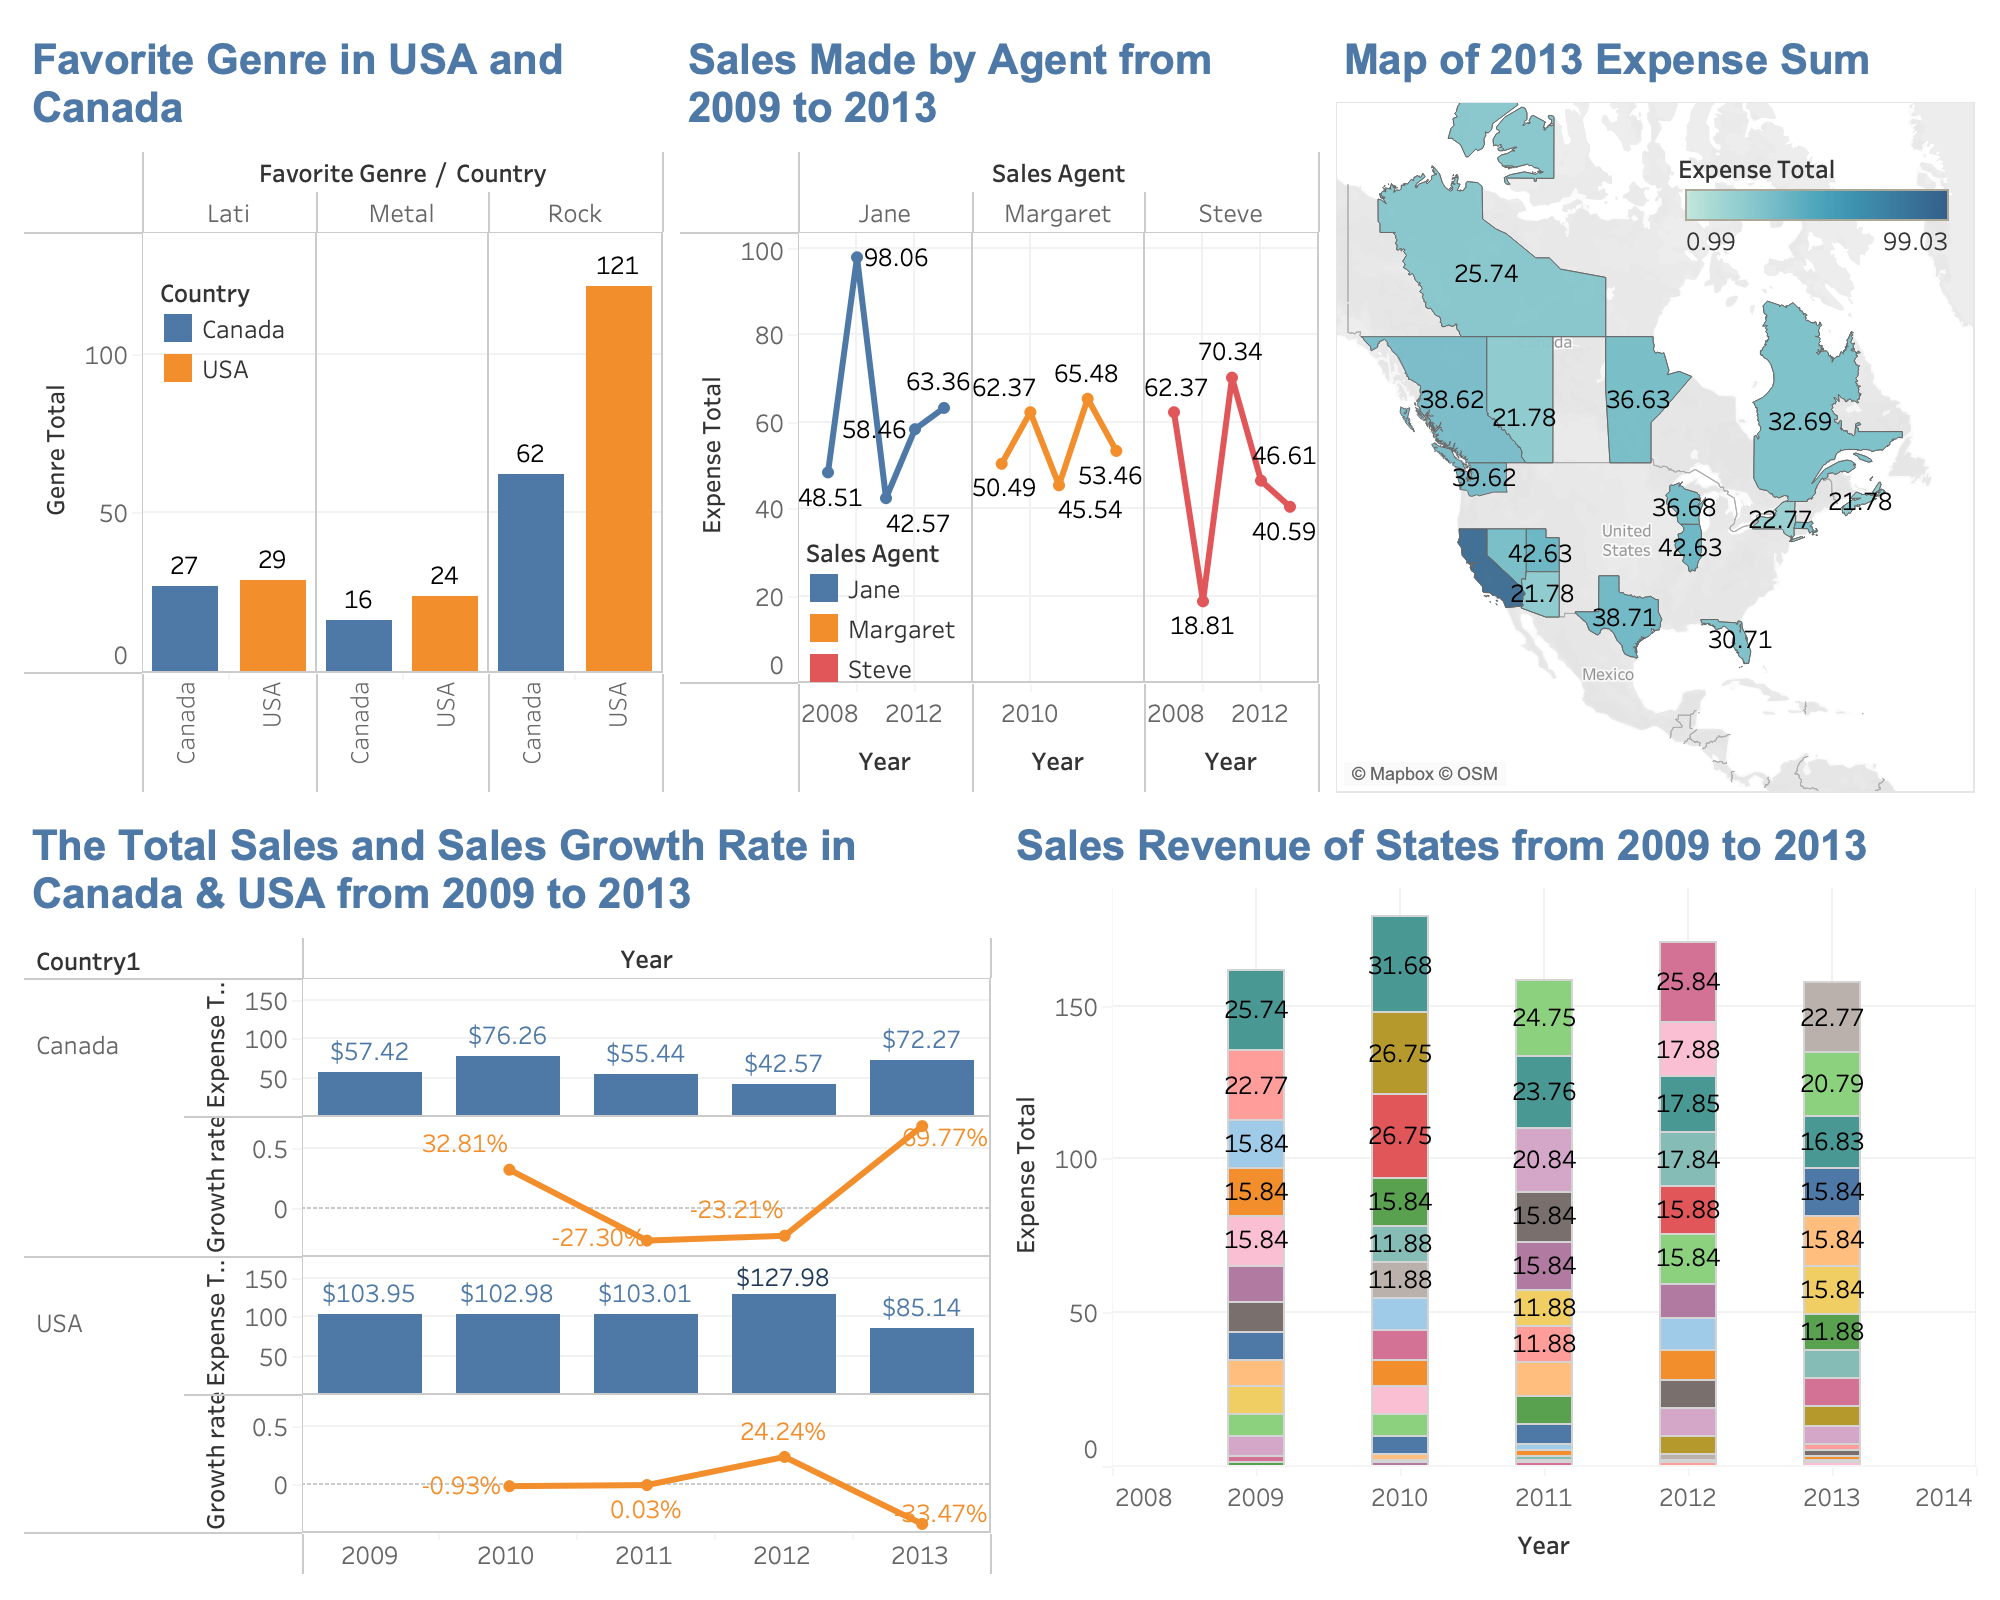
Data Warehouse Design and Dashboard for an Album Store
Constructed a data warehouse of 8 tables about invoce data and customer data of an album store in the US and Canada market. Used Tablaeu to visualized relavant data for next step to generate business insights.
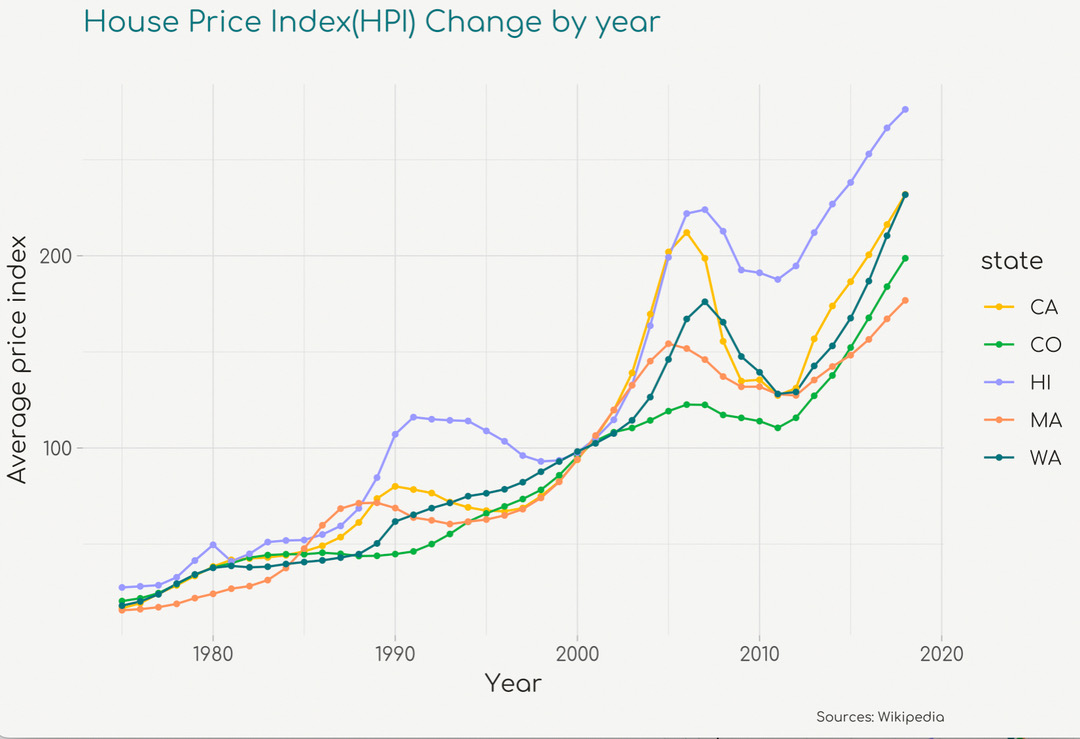
House Price Index Analytics - ggplot in R
Freddie Mac publishes the monthly index values of the Freddie Mac House Price Index each quarter. Index values are available for the nation, the 50 states and the District of Columbia, and the more than 380 metropolitan statistical areas in the US. This project involved data cleaning and data manipulation. I really had fun with ggplot2 package in R.
Page template forked from evanca